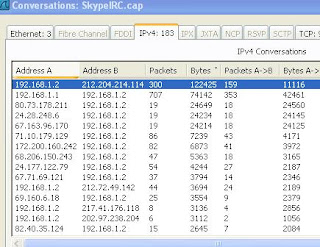
Some of you that know me know that, at one time, I had played around with Ethereal (now known as Wireshark) for a while. I readily admit that I don’t know that much about protocol analyzers, but I know enough about this product to explain why it might be helpful to school districts.
At some point, most network administrators want to determine why things are “slow”, what’s passing across their network, etc. There are bandwidth monitoring tools for our district internet connection (our KETSVIEW graphs, created (I believe) with something like Cacti. MRTG and PRTG are also popular graphing tools that districts have used over the years. These tools are great at graphing traffic across particular ports. If you haven’t implemented something like this, I recommend it as a great first step. If you don’t have some way of visualizing your Internet traffic in this manner, that’s a good place to start. Districts might also want to graph high-traffic ports such as those for critical servers and for connections to outlying schools and/or wiring closets. Having that visual is usually the easiest way to determine if a traffic issue is emanating from a particular school or IDF.
At some point, though, the admin usually wants to determine which workstation (or IP address) is the source of a great deal of traffic. This is where you can use a protocol analyzer such as Wireshark. For the purposes of this discussion, let’s assume that the traffic concern indeed involves something going to/from the Internet connection. We want to use a station running Wireshark to help us determine the source of the problem. This would require our workstation to ‘see’ the traffic coming to/from the port of the Internet connection, which would require us to mirror the Internet port to some port where we can plug in our monitoring station running Wireshark. You’ll need to consult your network documentation to determine how to mirror the port(s) appropriately.
Assuming the port is mirrored, you’d start a network capture with Wireshark and ‘see’ the traffic going across that port. I’m glossing over this, but most ambitious network admins can figure out how to at least capture some data once the proper ports are mirrored. If you stop that capture, I’ll attempt to add a screen shot of a sample capture (downloaded from the Wireshark site) that you might see.
THIS is where I often hear of people giving up. How can I determine what I’m looking at? All of the techno-info is a blinding series of letters and numbers!
It needn’t be this confusing. You can simply select ‘Statistics’ and then choose ‘Conversations’ from the menu area to be given a report of all of the conversations that took place during your traffic capture. Choose the “IPV4” tab and the resulting data can be sorted by the number of bytes in decreasing order.
This isn’t an answer to everything but, if you are curious about the top talkers during a period of time, this tool might help you find them. This is simply meant to show an easy way to find the offending IP address for you to investigate. The packet details are there to lead you to the program or type of traffic being generated, but I’ll save that for another time.
For more on Wireshark…here is some shameless self promotion…
http://nostarch.com/packet.htm
http://www.chrissanders.org