I had originally intended to create a blog entry about NetSpot. This week, one of my CIOs (John McMillen – @ujdmc) was using this tool to check out the wireless environment at his high school. He beat me to the proverbial punch and blogged about his experience at http://techucation.tumblr.com/post/47109360332/to-know-is-better-than-not-netspot-wireless-site. It’s a good overview of a useful tool, so check that out for details on the application.
I accompanied him for part of his analysis and have talked to a few other districts about the tool. I had toyed with Wi-Fi site surveys years ago, but the landscape has grown exponentially since then and I’ve used John’s project as an excuse to try to brush up a bit on the wireless environment and vocabulary associated with it. As I read about and tested the NetSpot product, I gravitated to the reports about signal strength… because everyone wants a strong wireless signal, right? The documentation pointed out that the more important report was the signal-to-noise ratio (SNR). Of course, that sounds really important, but what is the SNR?
There are tools available for both PC and Mac that allow you to scan your wireless environment. I was unaware (until today, frankly) of the built-in Mac WiFi Diagnostic utility. I’ll attach a screen shot from that utility.
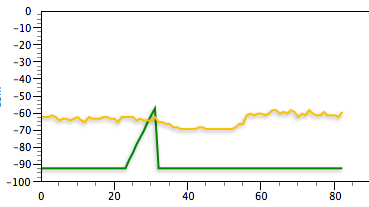
On this graph, the green line is the signal strength that my WiFi card was detecting. You’ll note that the range here was between -60 and -70. The units here are dBm, which is decibels to milliwatt, and feel free to read more about it at your leisure. A higher number is better but, as the graph indicates, you’ll never get to zero in a WiFi environment. A value of -10dBm to -30dBm would be really good. I can toy with my home wireless settings, changing the signal and location of my device, and get between -4x and -7x dBm. Higher is better, but keep in mind that all of this is discussing the signal.
The red line that, for the most part, stayed at about -92dBm was the measure of the noise. What’s the noise? Well, have you ever tuned in an AM or FM radio station and gotten a mix of static, bleed-in from other stations and the actual signal you’re after? It’s all “noise” in the frequency area that you’re tuning. It should make sense that more noise is bad, so we’re searching for a lower number here. SO… put it all together and you’re after the best signal with the least noise. The delta between the two values is your signal-to-noise ratio. You can live with a less-than-optimal signal if you have very little noise. If there’s a good bit of noise on the network, even a decent signal strength might not be able to overcome the noise. Just as you lose your radio signal if the “noise” overrides the strength of the signal, you can lose your WiFi connection if the noise overrides the signal strength.
Honestly, the term ‘ratio’ may not be applicable here, as the SNR is expressed as the difference between the signal and noise values. Using my home example, my signal was around -60dBm and the noise was roughly -92dBm. My SNR would be expressed as 32 (in that example). So what is a good SNR? I suppose opinions vary and you can use your favorite search engine (as I did) to get opinions on this. I’ve read that anything around or above 25 is good.
Let’s use a NetSpot site survey to make a final point regarding SNR:
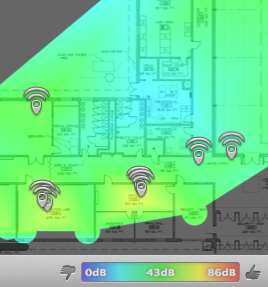
This is a visual report of SNR created by NetSpot. Note the legend at the bottom that shows blue as 0dB, green(ish) as 43dB and up to red as 86dB. When running this tool, I initially wondered why everything was green (which looks average) and nothing was red (which looks to be very good). This school had a really strong wireless network, so why isn’t the SNR showing red? Hopefully, now that we know a bit more about SNR, you can see that a difference in the 86dB range is next to impossible to obtain. Nearly everything is green, which is closer to 43db and well above 25db, which would be a good SNR. It’s fair to wonder about the bluish areas on the screen, but I didn’t scan certain areas on that map and that’s why the areas of blue are showing up. Had I scanned in that area, the map would have likely filled out those areas in green.
One last thing… if you noticed the large blip in my noise calculation on my home network, you might wonder what the ‘noise’ blip was. I was trying to create different signal and noise factors and I switched my home router from “b/g/n” wireless to “n-only”. Any sort of change with the wireless signal type definitely introduces some noise as it reconfigures!